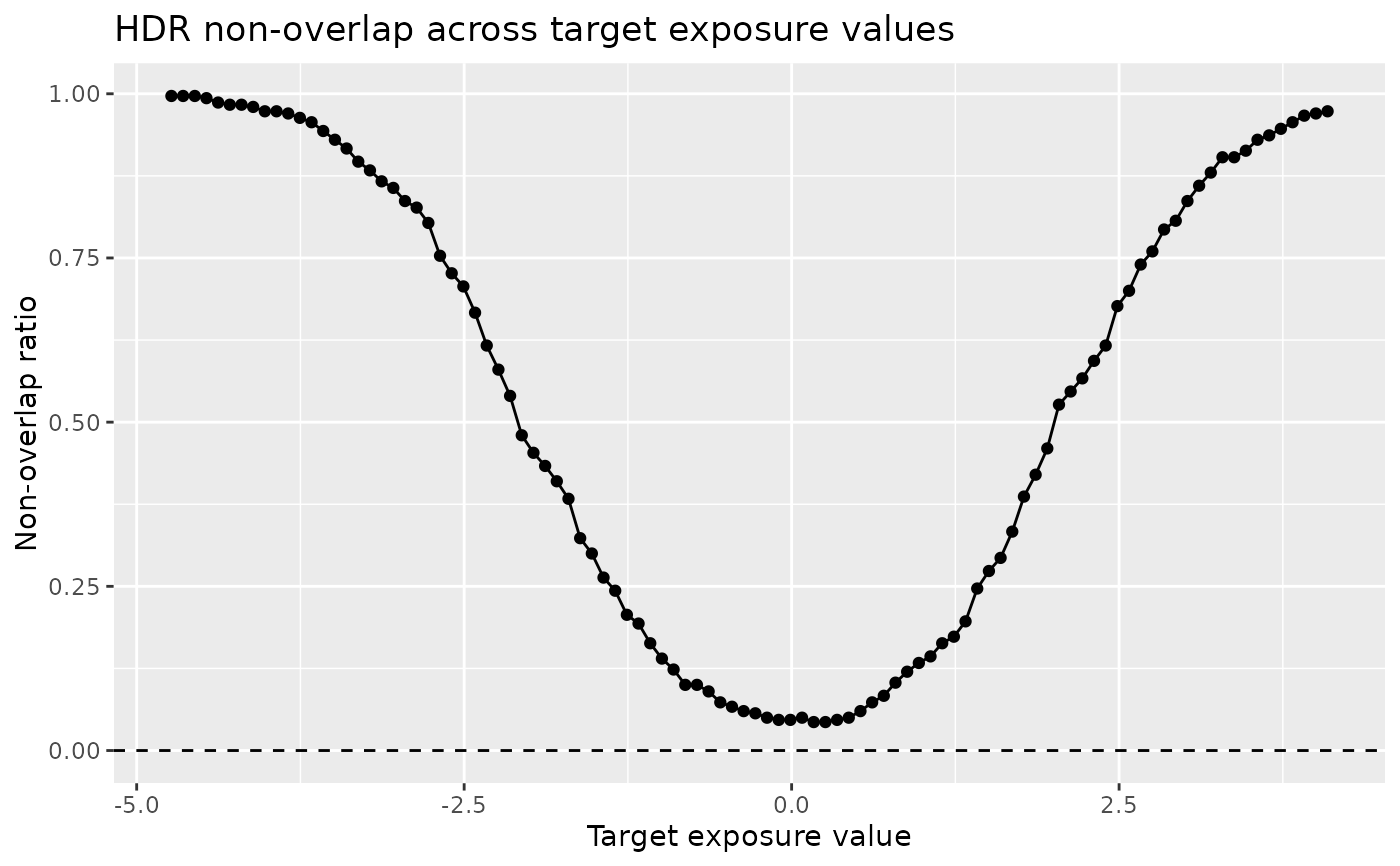
Draws the non-overlap ratio \(\hat{\tau}(a)\) against the target exposure
value a, with a reference line at zero. For a sequential result the curves
are colored by time point. pull_plot_data() returns the tibble this view
draws.
Arguments
- object
An
hdr_resultfromcheck_hdr()orcheck_hdr_seq().- ...
Not used.
Value
A ggplot2::ggplot object.