Draws one of two views of a check_hat_values() result. type = "null"
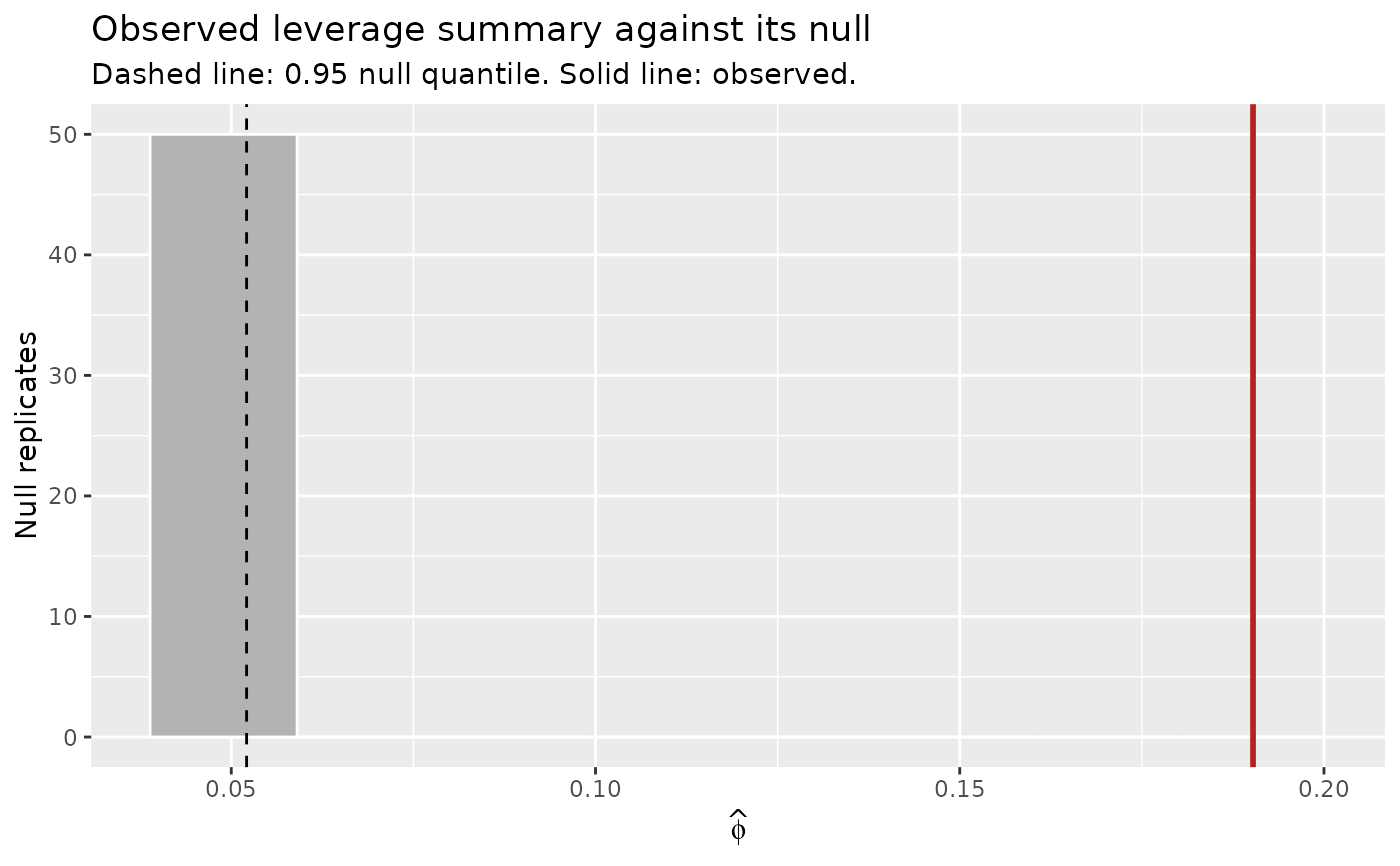
shows the null distribution of \(\hat{\phi}\) as a histogram with the
observed \(\hat{\phi}\) and the conf_level null quantile marked.
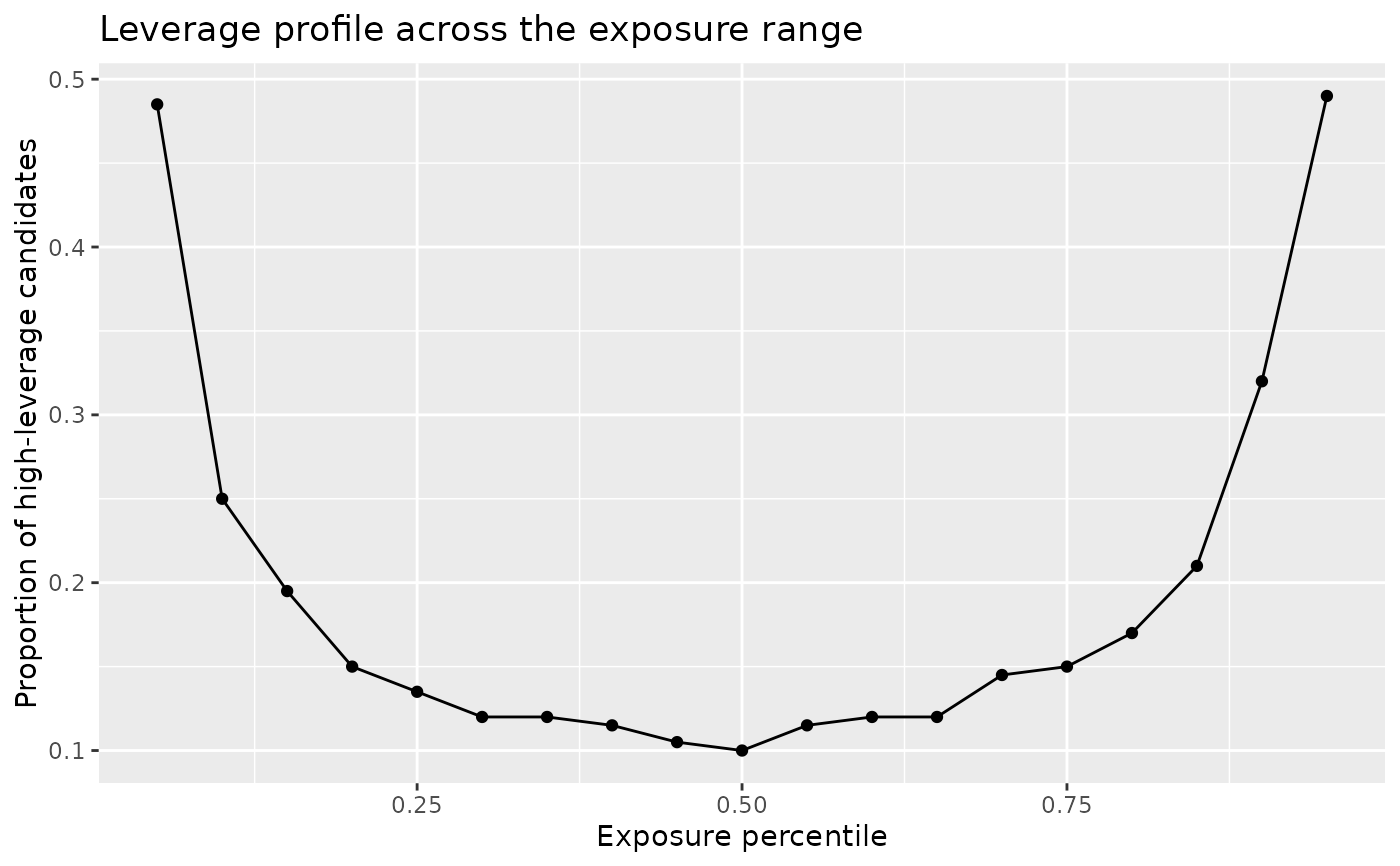
type = "profile" shows the proportion of high-leverage candidates at each
exposure percentile, the leverage profile across the exposure range.
pull_plot_data() returns the tibble either of these views draws.
Arguments
- object
A
hat_values_resultfromcheck_hat_values().- type
One of
"null"or"profile".- ...
Not used.
Value
A ggplot2::ggplot object.
Examples
set.seed(1)
n <- 200
x1 <- rnorm(n)
dose <- rnorm(n, mean = x1)
df <- data.frame(dose = dose, x1 = x1)
# null_reps is small here to keep the example fast.
result <- check_hat_values(df, dose, x1, null_reps = 50)
autoplot(result, type = "null")
 autoplot(result, type = "profile")