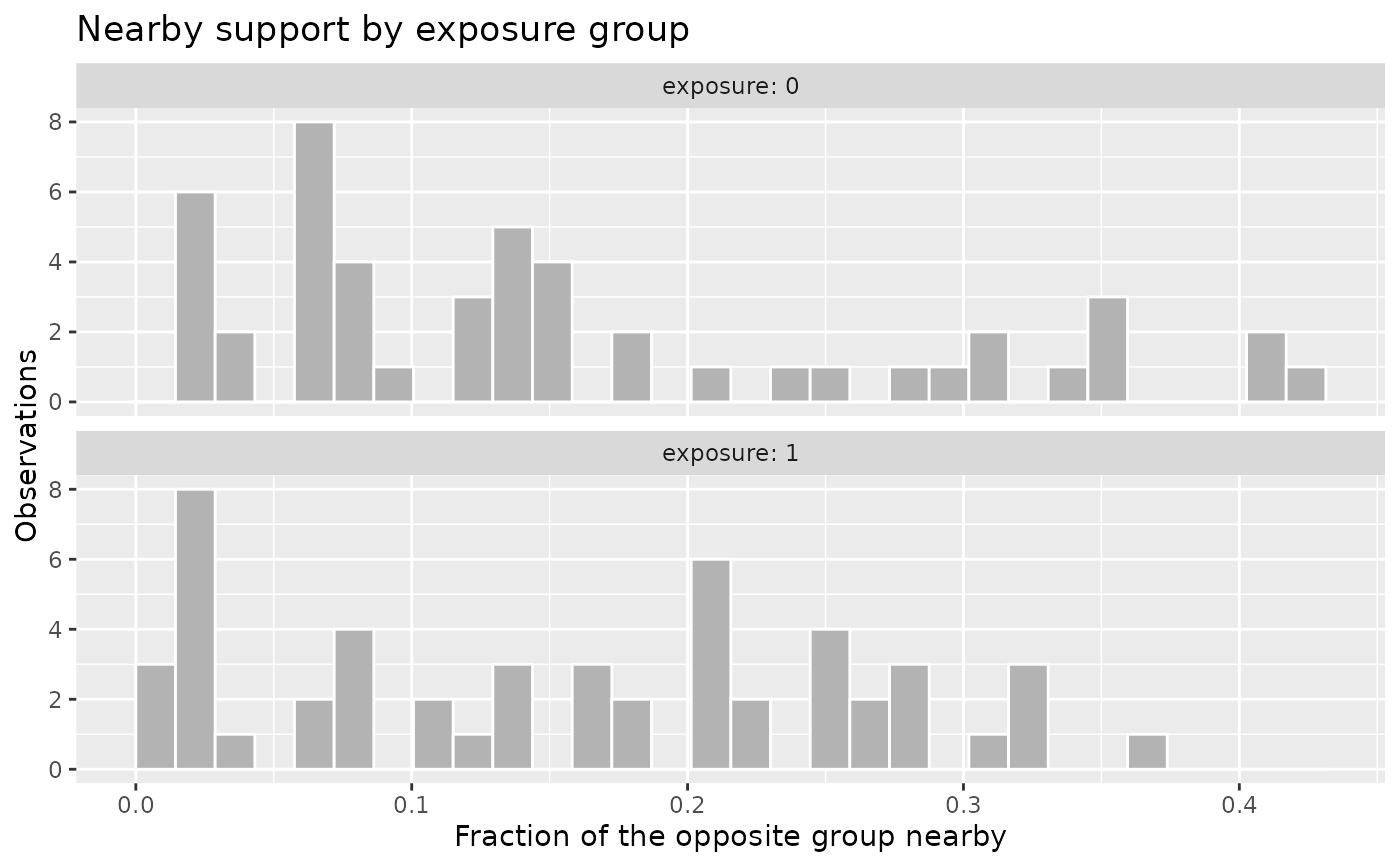
Draws one of two views of a check_extrapolation() result.
type = "distribution" shows the distribution of frac_nearby as histograms
faceted by exposure group, the share of the opposite group that lies nearby
each observation. type = "hull" shows convex-hull membership as stacked bars
per exposure group, and is available only when the hull test ran.
pull_plot_data() returns the tibble either of these views draws.
Arguments
- object
An
extrapolation_resultfromcheck_extrapolation().- type
One of
"distribution"or"hull".- ...
Not used.
Value
A ggplot2::ggplot object.
Examples
set.seed(1)
n <- 100
x1 <- rnorm(n)
x2 <- rnorm(n)
exposure <- rbinom(n, 1, plogis(0.5 * x1 - 0.5 * x2))
df <- data.frame(exposure = exposure, x1 = x1, x2 = x2)
result <- check_extrapolation(df, exposure, c(x1, x2), hull = FALSE)

autoplot(result, type = "distribution")