Draws one view of a check_edp() result. type = "boxplot", the default,
boxes EDP by intervention. Its whiskers reach the fifth and the ninety-fifth
percentile, following Ring and Schomaker (2026) rather than Tukey's fences,
and the values outside them are drawn as points. For the estimator variant
it draws the outcome-model and the treatment-model measure side by side in a
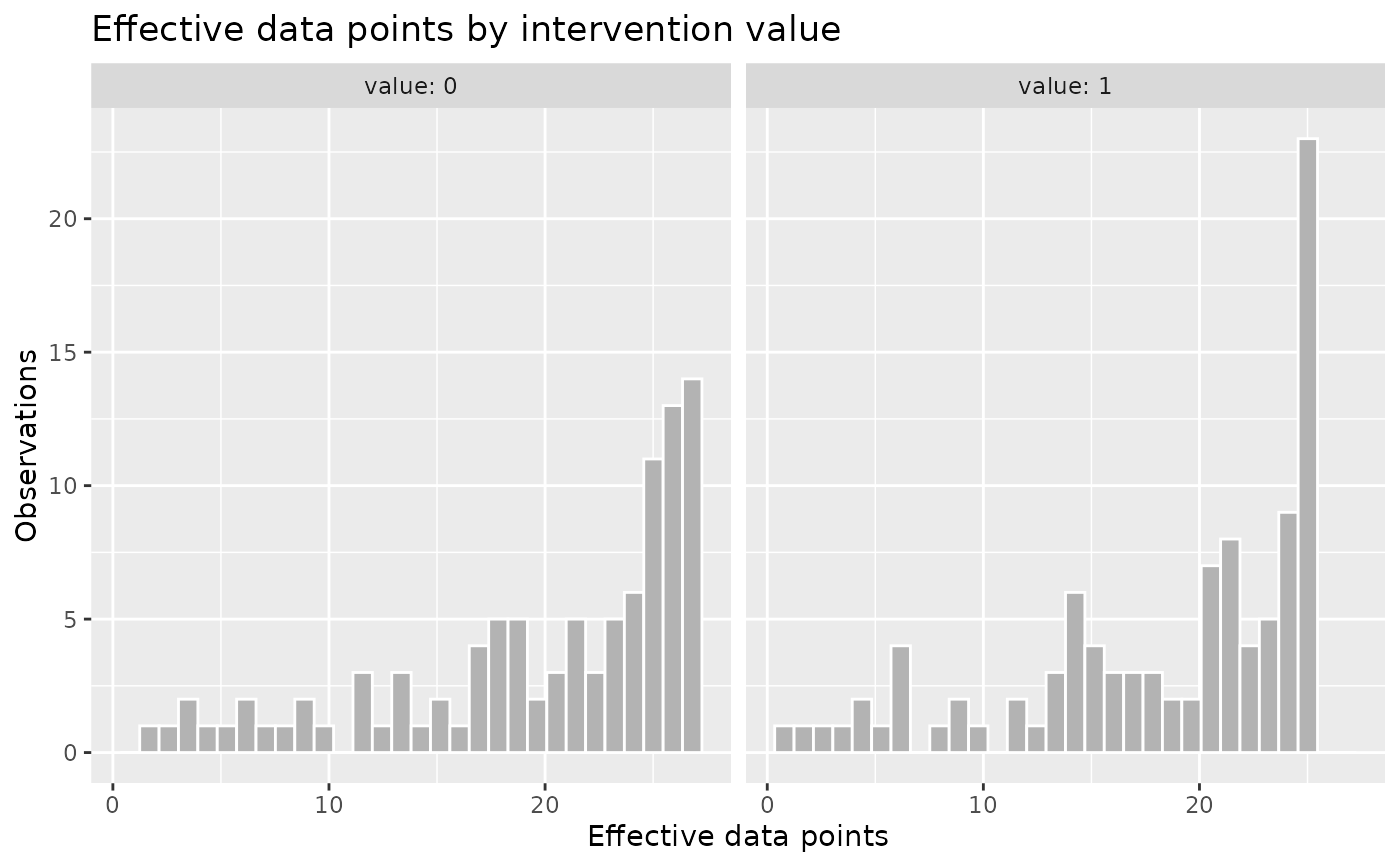
facet per intervention. type = "histogram" shows the distribution of EDP
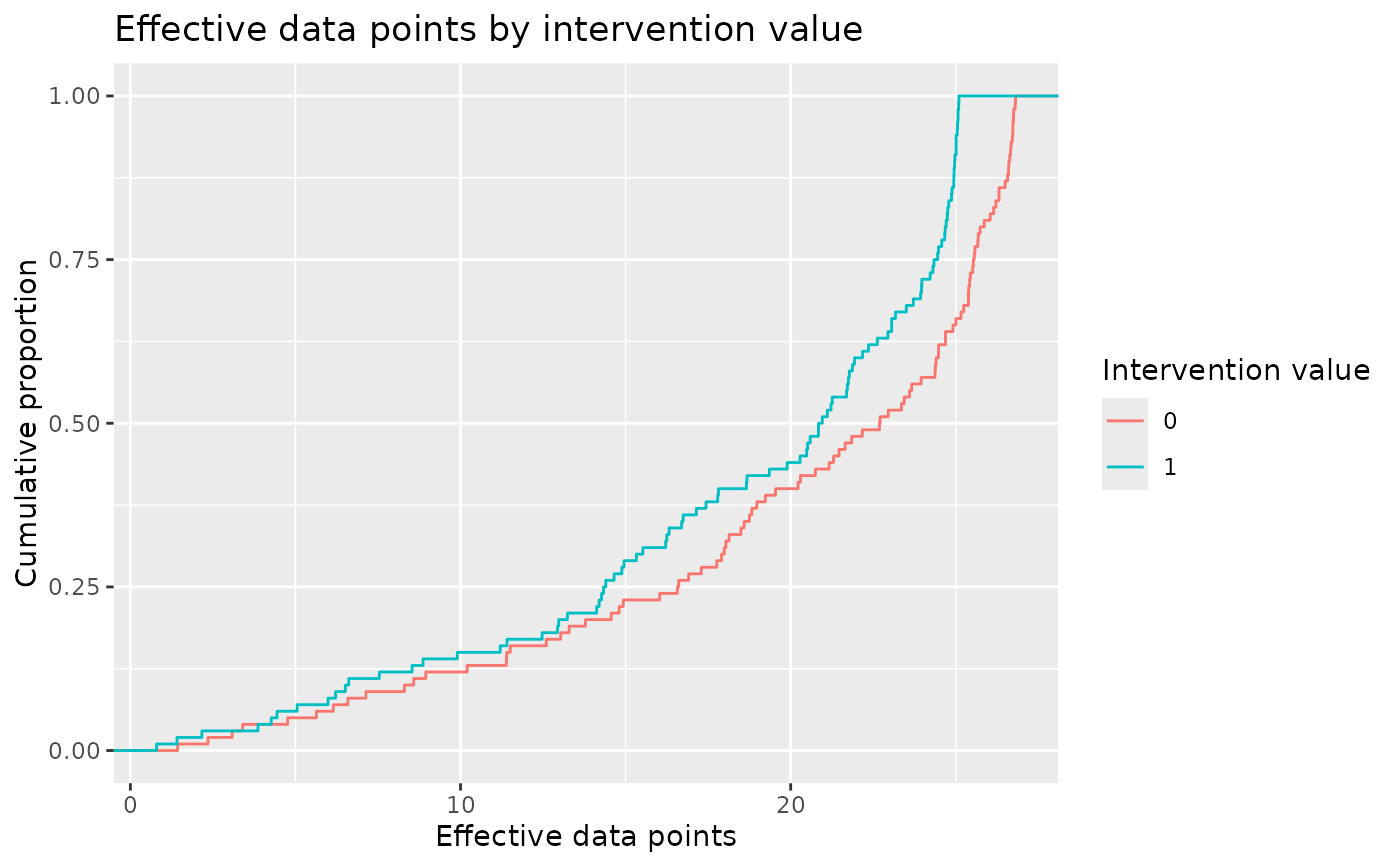
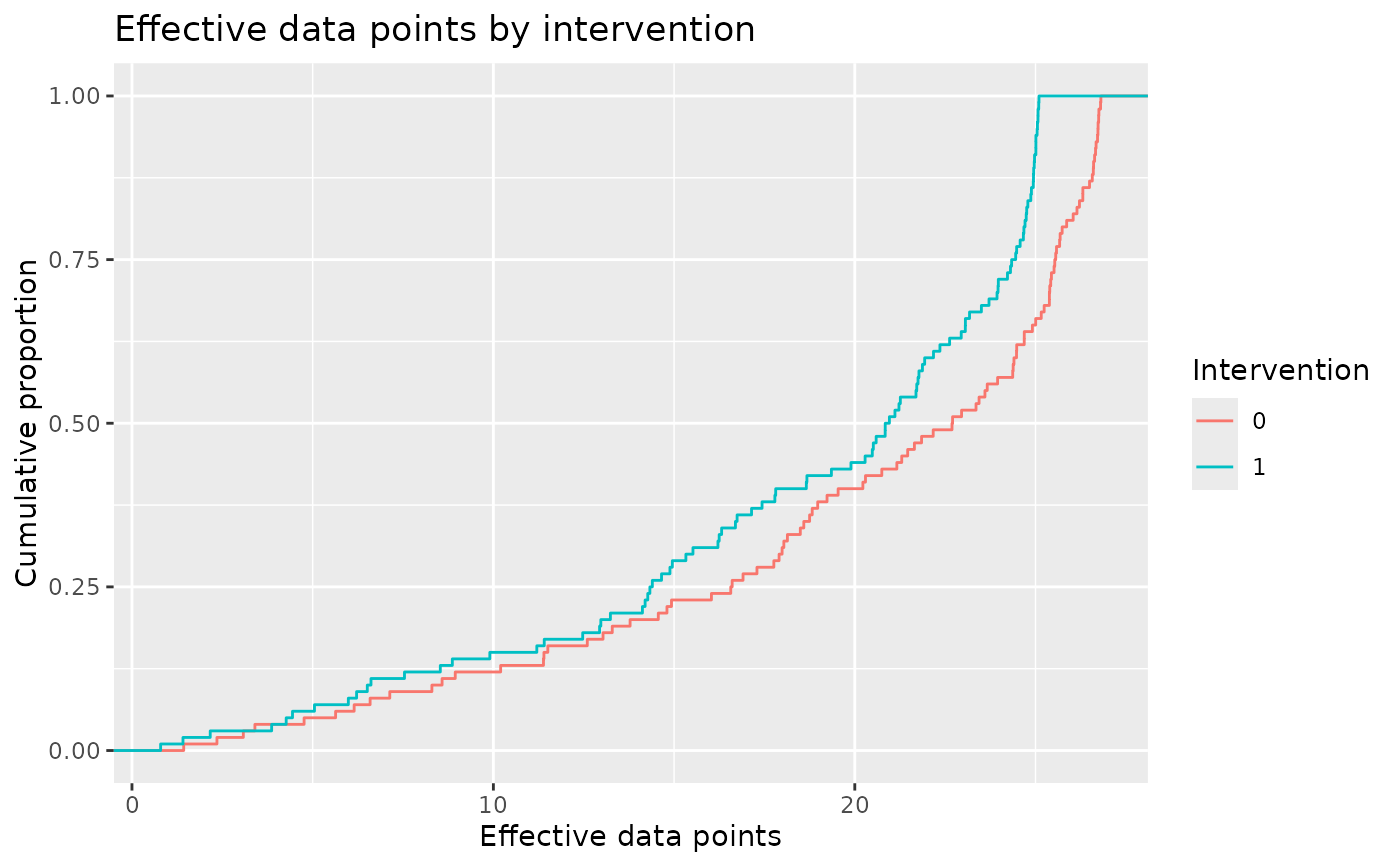
faceted by intervention, type = "ecdf" shows its empirical cumulative
distribution colored by intervention, and type = "density" draws one
density ridgeline per intervention, which needs the ggridges package.
Each of those three draws one measure: edp for the data variant and
edp_outcome for the estimator variant, the measure carrying the exposure
dimension and so the one an intervention moves. type = "scatter" plots
edp_outcome against edp_treatment colored by ideal_weight; it needs
the estimator variant and aborts for the data variant.
pull_plot_data() returns the tibble any of these views draws.
Arguments
- object
An
edp_resultfromcheck_edp().- type
One of
"boxplot","histogram","ecdf","density", or"scatter".- ...
Not used.
Value
A ggplot2::ggplot object.