Draws one of two views of a check_density_ratios() result.
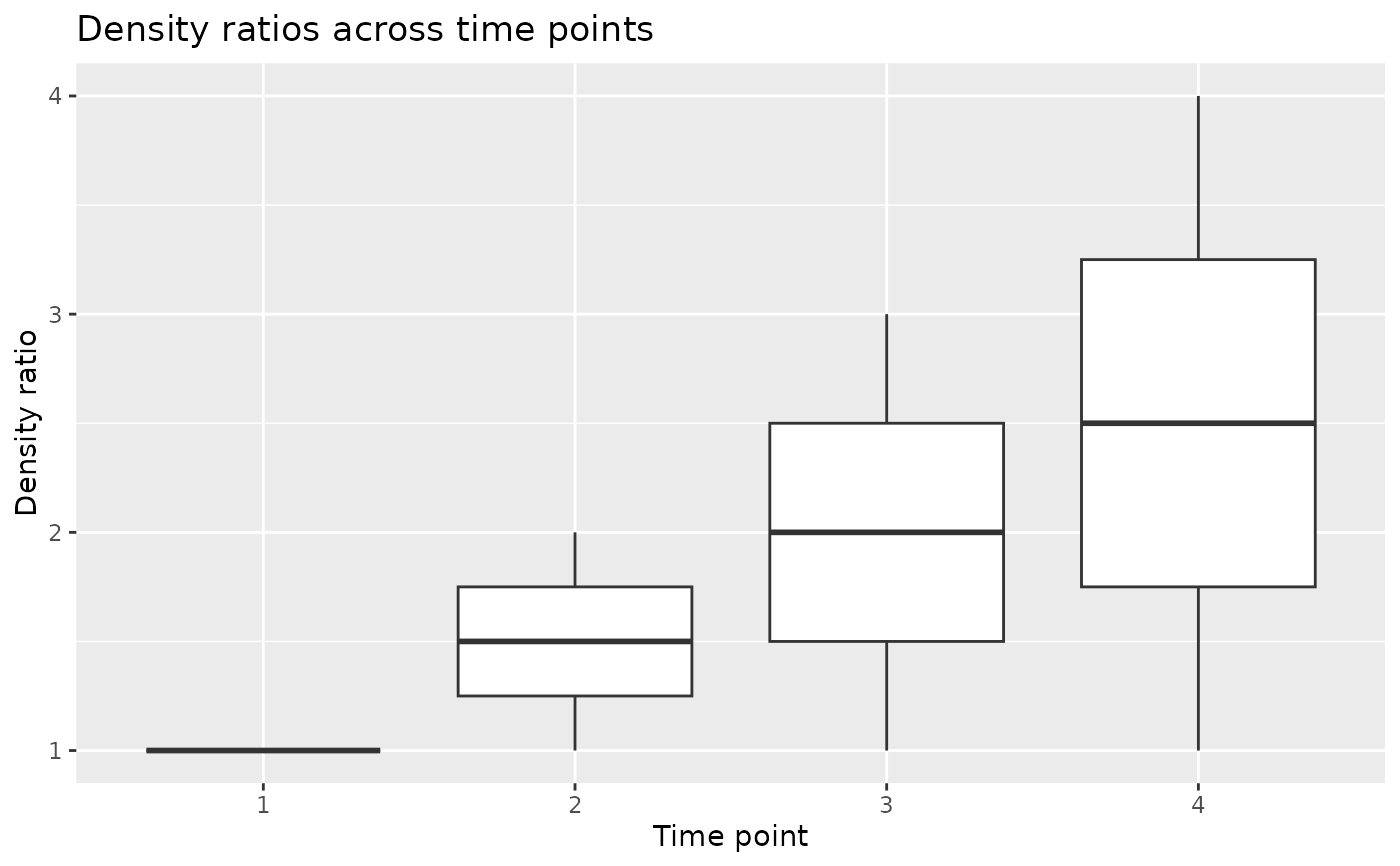
type = "distribution" shows the distribution of the raw ratios: a histogram
for a point treatment and a per-time boxplot for a time-varying treatment.
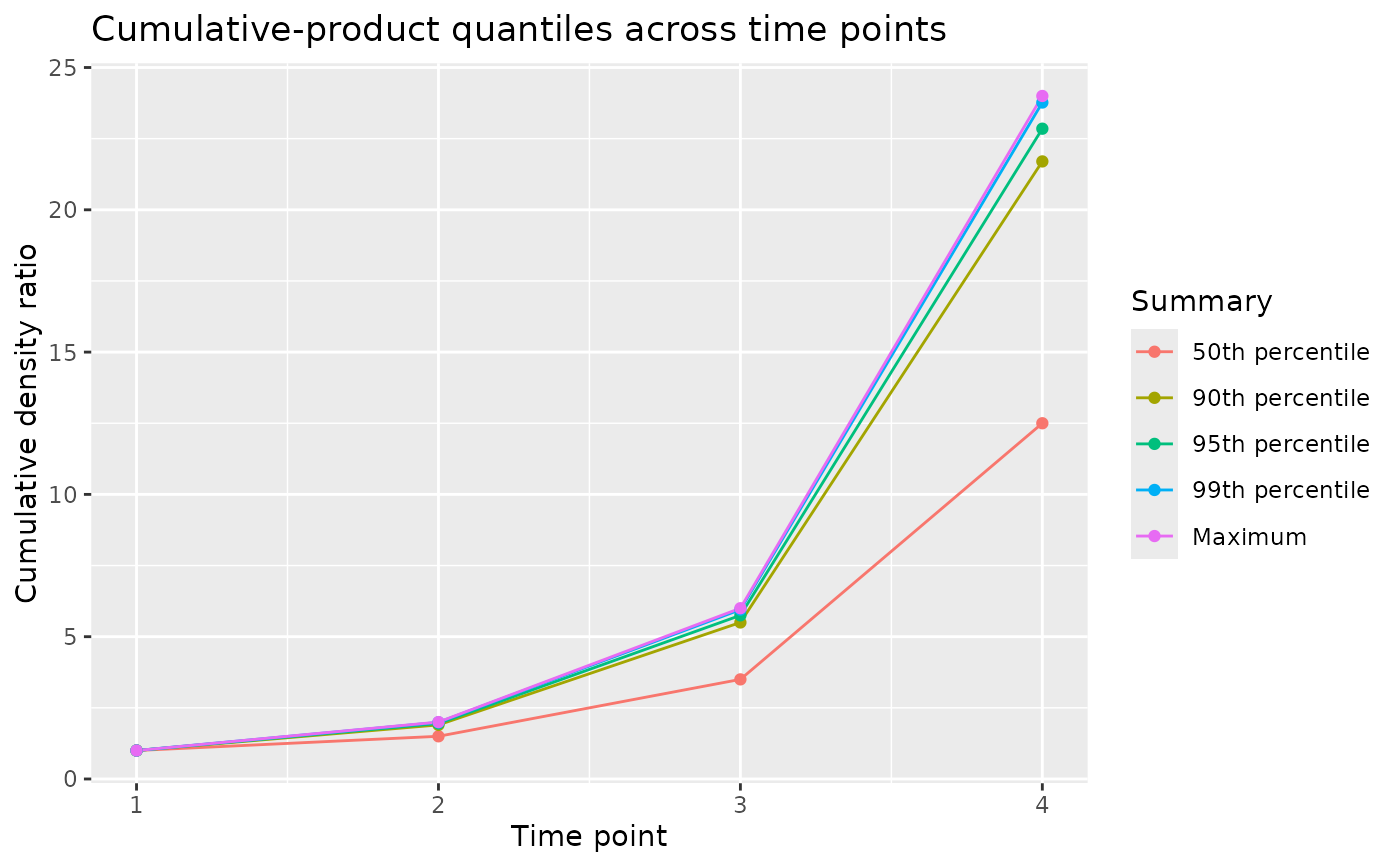
type = "cumulative" shows the cumulative-product quantiles across time
points, the sequential positivity signature, and is available for matrix
inputs. pull_plot_data() returns the tibble either of these views draws.
Arguments
- object
A
density_ratios_resultfromcheck_density_ratios().- type
One of
"distribution"or"cumulative".- ...
Not used.
Value
A ggplot2::ggplot object.
Examples
m <- matrix(c(1, 1, 2, 1, 3, 1, 4, 1), nrow = 2)
result <- check_density_ratios(m)
autoplot(result, type = "distribution")
 autoplot(result, type = "cumulative")