Tidy a dagitty object
Usage
tidy_dagitty(
  .dagitty,
  seed = NULL,
  layout = ggdag_option("layout", "nicely"),
  ...,
  use_existing_coords = TRUE
)
Arguments
- .dagitty
a
dagitty- seed
a numeric seed for reproducible layout generation
- layout
a layout available in
ggraph. Seeggraph::create_layout()for details. Alternatively,"time_ordered"will usetime_ordered_coords()to algorithmically sort the graph by time. You can also pass the result oftime_ordered_coords()directly: either the function returned when called with no arguments, or the coordinate tibble returned when called with arguments.- ...
optional arguments passed to
ggraph::create_layout()- use_existing_coords
(Advanced). Logical. Use the coordinates produced by
dagitty::coordinates(.dagitty)? If the coordinates are empty,tidy_dagitty()will generate a layout. Generally, setting this toFALSEis thus only useful when there is a difference in the variables coordinates and the variables in the DAG, as sometimes happens when recompiling a DAG.
Examples
library(dagitty)
library(ggplot2)
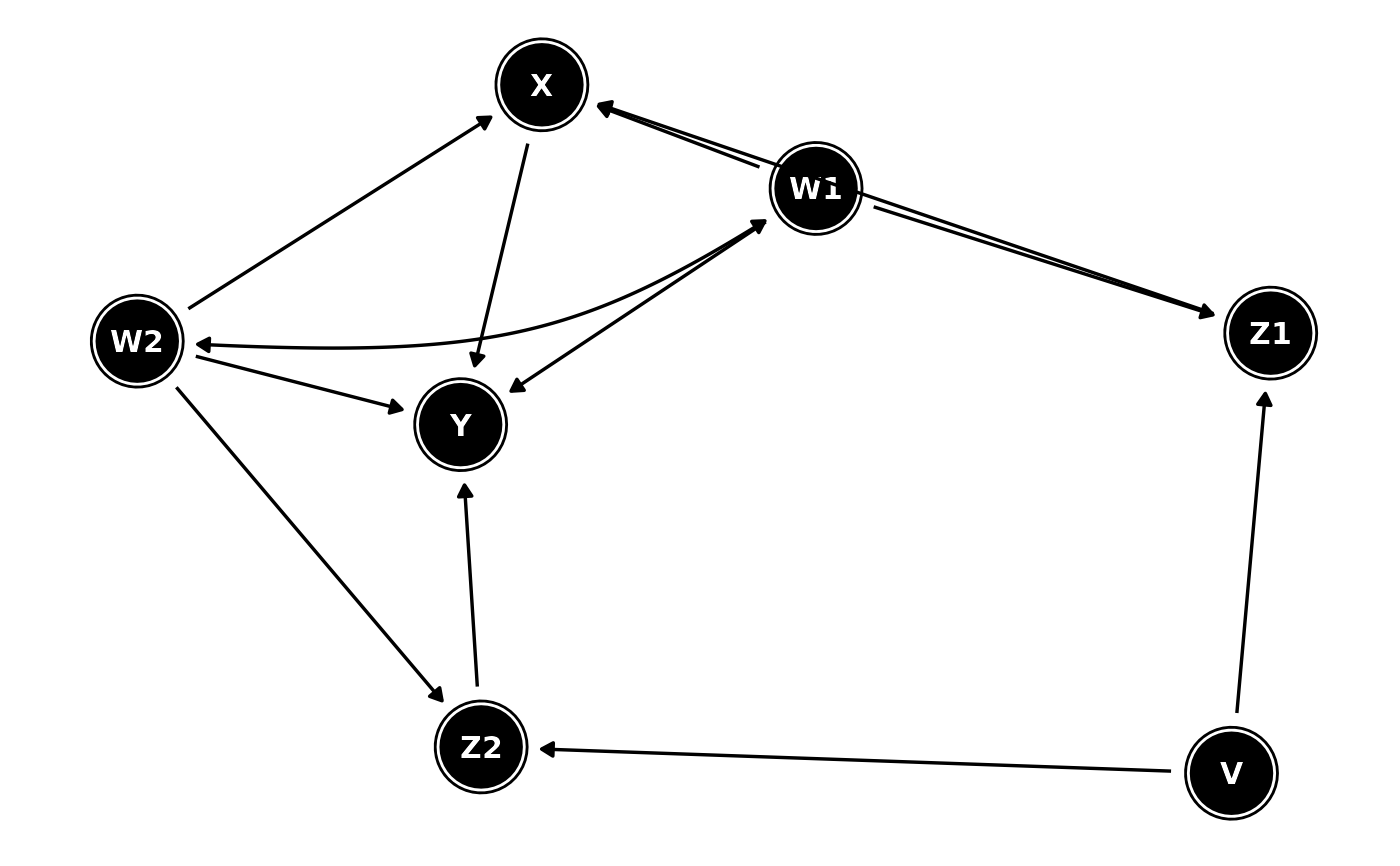
dag <- dagitty("dag {
Y <- X <- Z1 <- V -> Z2 -> Y
Z1 <- W1 <-> W2 -> Z2
X <- W1 -> Y
X <- W2 -> Y
X [exposure]
Y [outcome]
}")
tidy_dagitty(dag)
#> # DAG:
#> # A `dagitty` DAG with: 7 nodes and 12 edges
#> # Exposure: X
#> # Outcome: Y
#> #
#> # Data:
#> # A tibble: 13 × 7
#> name x y direction to xend yend
#> <chr> <dbl> <dbl> <fct> <chr> <dbl> <dbl>
#> 1 V -1.49 0.0000120 -> Z1 -0.510 -1.01
#> 2 V -1.49 0.0000120 -> Z2 -0.510 1.01
#> 3 W1 0.934 -0.588 -> X 0.322 -0.466
#> 4 W1 0.934 -0.588 -> Y 0.322 0.466
#> 5 W1 0.934 -0.588 -> Z1 -0.510 -1.01
#> 6 W1 0.934 -0.588 <-> W2 0.934 0.588
#> 7 W2 0.934 0.588 -> X 0.322 -0.466
#> 8 W2 0.934 0.588 -> Y 0.322 0.466
#> 9 W2 0.934 0.588 -> Z2 -0.510 1.01
#> 10 X 0.322 -0.466 -> Y 0.322 0.466
#> 11 Y 0.322 0.466 NA NA NA NA
#> 12 Z1 -0.510 -1.01 -> X 0.322 -0.466
#> 13 Z2 -0.510 1.01 -> Y 0.322 0.466
#> #
#> # ℹ Use `pull_dag() (`?pull_dag`)` to retrieve the DAG object and `pull_dag_data() (`?pull_dag_data`)` for the data frame
tidy_dagitty(dag, layout = "fr") |>
ggplot(aes(x = .data$x, y = .data$y, xend = .data$xend, yend = .data$yend)) +
geom_dag_node() +
geom_dag_text() +
geom_dag_edges() +
theme_dag()