These functions are minor modifications of those in the ggrepel package.
geom_dag_text_repel() adds text directly to the plot.
geom_dag_label_repel() draws a rectangle underneath the text, making it
easier to read. The text labels repel away from each other and away from the
data points. geom_dag_label_repel2() is a slightly stylized version of
geom_dag_label_repel() that often looks better on DAGs.
geom_dag_text_repel2() is a slightly stylized version of
geom_dag_text_repel() that often looks better on DAGs.
Usage
geom_dag_text_repel(
  mapping = NULL,
  data = NULL,
  stat = "identity",
  position = "identity",
  parse = FALSE,
  ...,
  node_size = NULL,
  n_edge_points = NULL,
  n_node_points = NULL,
  box.padding = 1.25,
  point.padding = 1,
  min.segment.length = 0.5,
  segment.color = "#666666",
  segment.alpha = 1,
  fontface = "bold",
  segment.size = 0.5,
  arrow = NULL,
  force = 1,
  force_pull = 1,
  max.time = 0.5,
  max.iter = 2000,
  max.overlaps = Inf,
  nudge_x = 0,
  nudge_y = 0,
  xlim = c(NA, NA),
  ylim = c(NA, NA),
  na.rm = FALSE,
  show.legend = NA,
  direction = c("both", "y", "x"),
  seed = NA,
  verbose = getOption("verbose", default = FALSE),
  inherit.aes = TRUE
)

geom_dag_label_repel(
  mapping = NULL,
  data = NULL,
  stat = "identity",
  position = "identity",
  parse = FALSE,
  ...,
  node_size = NULL,
  n_edge_points = NULL,
  n_node_points = NULL,
  box.padding = grid::unit(1.25, "lines"),
  label.padding = grid::unit(0.25, "lines"),
  point.padding = grid::unit(1, "lines"),
  label.r = grid::unit(0.15, "lines"),
  label.size = 0.25,
  min.segment.length = 0.5,
  segment.color = "grey50",
  segment.alpha = 1,
  segment.size = 0.5,
  arrow = NULL,
  force = 1,
  force_pull = 1,
  max.time = 0.5,
  max.iter = 2000,
  max.overlaps = Inf,
  nudge_x = 0,
  nudge_y = 0,
  xlim = c(NA, NA),
  ylim = c(NA, NA),
  na.rm = FALSE,
  show.legend = NA,
  direction = c("both", "y", "x"),
  seed = NA,
  verbose = getOption("verbose", default = FALSE),
  inherit.aes = TRUE
)

geom_dag_label_repel2(
  mapping = NULL,
  data = NULL,
  box.padding = 2,
  max.overlaps = Inf,
  label.size = NA,
  linewidth = 0,
  ...
)

geom_dag_text_repel2(
  mapping = NULL,
  data = NULL,
  box.padding = 2,
  max.overlaps = Inf,
  ...
)
Arguments
- mapping
Set of aesthetic mappings created by
aesoraes_. If specified andinherit.aes = TRUE(the default), is combined with the default mapping at the top level of the plot. You only need to supplymappingif there isn't a mapping defined for the plot.- data
A data frame. If specified, overrides the default data frame defined at the top level of the plot.
- stat
The statistical transformation to use on the data for this layer, as a string.
- position
Position adjustment, either as a string, or the result of a call to a position adjustment function.
- parse
If TRUE, the labels will be parsed into expressions and displayed as described in ?plotmath
- ...
other arguments passed on to
layer. There are three types of arguments you can use here:Aesthetics: to set an aesthetic to a fixed value, like
colour = "red"orsize = 3.Other arguments to the layer, for example you override the default
statassociated with the layer.Other arguments passed on to the stat.
- node_size
The size of the DAG nodes, used to compute the
point.sizeaesthetic so that labels repel from the node boundary rather than the node center. Defaults toNULL, which auto-discovers the size from a node layer (geom_dag_node()orgeom_dag_point()) already added to the plot. Falls back to 16 if no node layer is found.- n_edge_points
Number of invisible points to interpolate along each edge. These "fake" points participate in ggrepel's repulsion calculation so that labels avoid overlapping edges. Defaults to
NULL, which uses theStatNodesRepeldefault of 50. Set to 0 to disable edge-aware repulsion.- n_node_points
Number of invisible points to place around each node's perimeter. These skeleton points help ggrepel push labels away from node boundaries. Defaults to
NULL, which uses theStatNodesRepeldefault of 12. Set to 0 to disable node skeleton repulsion.- box.padding
Amount of padding around bounding box, as unit or number. Defaults to 0.25. (Default unit is lines, but other units can be specified by passing
unit(x, "units")).- point.padding
Amount of padding around labeled point, as unit or number. Defaults to 0. (Default unit is lines, but other units can be specified by passing
unit(x, "units")).- min.segment.length
Skip drawing segments shorter than this, as unit or number. Defaults to 0.5. (Default unit is lines, but other units can be specified by passing
unit(x, "units")).- segment.color, segment.size
- segment.alpha
Transparency of the line segment. Set to NULL (default) to use ggrepel's default behavior, or provide a value between 0 and 1
- fontface
A character vector. Default is "bold"
- arrow
specification for arrow heads, as created by
arrow- force
Force of repulsion between overlapping text labels. Defaults to 1.
- force_pull
Force of attraction between a text label and its corresponding data point. Defaults to 1.
- max.time
Maximum number of seconds to try to resolve overlaps. Defaults to 0.5.
- max.iter
Maximum number of iterations to try to resolve overlaps. Defaults to 10000.
- max.overlaps
Exclude text labels when they overlap too many other things. For each text label, we count how many other text labels or other data points it overlaps, and exclude the text label if it has too many overlaps. Defaults to 10.
- nudge_x, nudge_y
Horizontal and vertical adjustments to nudge the starting position of each text label. The units for
nudge_xandnudge_yare the same as for the data units on the x-axis and y-axis.- xlim, ylim
Limits for the x and y axes. Text labels will be constrained to these limits. By default, text labels are constrained to the entire plot area.
- na.rm
If
FALSE(the default), removes missing values with a warning. IfTRUEsilently removes missing values.- show.legend
logical. Should this layer be included in the legends?
NA, the default, includes if any aesthetics are mapped.FALSEnever includes, andTRUEalways includes.- direction
"both", "x", or "y" – direction in which to adjust position of labels
- seed
Random seed passed to
set.seed. Defaults toNA, which means thatset.seedwill not be called.- verbose
If
TRUE, some diagnostics of the repel algorithm are printed- inherit.aes
If
FALSE, overrides the default aesthetics, rather than combining with them. This is most useful for helper functions that define both data and aesthetics and shouldn't inherit behaviour from the default plot specification, e.g.borders.- label.padding
Amount of padding around label, as unit or number. Defaults to 0.25. (Default unit is lines, but other units can be specified by passing
unit(x, "units")).- label.r
Radius of rounded corners, as unit or number. Defaults to 0.15. (Default unit is lines, but other units can be specified by passing
unit(x, "units")).- label.size
Size of label border, in mm.
- linewidth
Width of the label border in
geom_dag_label_repel2(). Default is 0 (no border). Set to a positive value to show borders.
Details
These geoms are wrappers around ggrepel::geom_text_repel() and
ggrepel::geom_label_repel() that use the custom StatNodesRepel
for better handling of DAG data. All arguments available in ggrepel
functions are supported.
Additional segment parameters can be passed through ..., including:
segment.linetype: Line stylesegment.alpha: Line transparencysegment.curvature: Curve amountsegment.angle: Curve anglesegment.ncp: Number of control pointssegment.shape: Control point positionsegment.square: Square formation control pointssegment.squareShape: Square formation shapesegment.inflect: Add inflection pointsegment.debug: Show debug information
You can also pass point.size and point.colour through ....
Examples
library(ggplot2)
g <- dagify(
m ~ x + y,
y ~ x,
exposure = "x",
outcome = "y",
latent = "m",
labels = c("x" = "Exposure", "y" = "Outcome", "m" = "Collider")
)
g |>
tidy_dagitty() |>
ggplot(aes_dag()) +
geom_dag_edges() +
geom_dag_point() +
geom_dag_text_repel(aes(label = name), show.legend = FALSE) +
theme_dag()
 # Use nudge_x and nudge_y to push labels away from nodes
g |>
tidy_dagitty() |>
ggplot(aes_dag()) +
geom_dag_edges() +
geom_dag_point() +
geom_dag_text_repel(
aes(label = name),
nudge_x = 0.1,
nudge_y = 0.1
) +
theme_dag()
# Use nudge_x and nudge_y to push labels away from nodes
g |>
tidy_dagitty() |>
ggplot(aes_dag()) +
geom_dag_edges() +
geom_dag_point() +
geom_dag_text_repel(
aes(label = name),
nudge_x = 0.1,
nudge_y = 0.1
) +
theme_dag()
 # Use position_nudge_repel for the same effect
g |>
tidy_dagitty() |>
ggplot(aes_dag()) +
geom_dag_edges() +
geom_dag_point() +
geom_dag_text_repel(
aes(label = name),
position = ggrepel::position_nudge_repel(x = 0.1, y = 0.1)
) +
theme_dag()
# Use position_nudge_repel for the same effect
g |>
tidy_dagitty() |>
ggplot(aes_dag()) +
geom_dag_edges() +
geom_dag_point() +
geom_dag_text_repel(
aes(label = name),
position = ggrepel::position_nudge_repel(x = 0.1, y = 0.1)
) +
theme_dag()
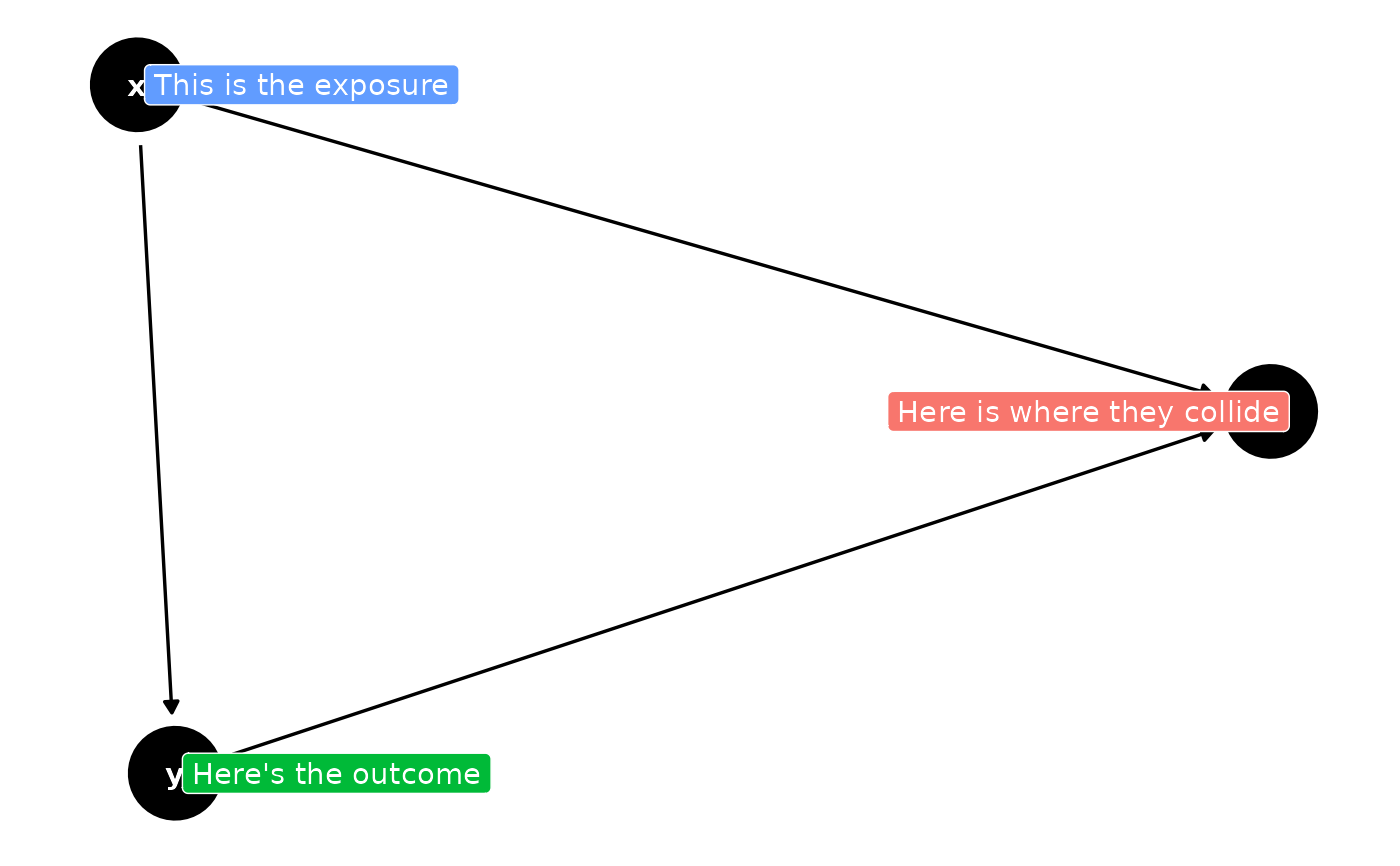
 g |>
tidy_dagitty() |>
dag_label(labels = c(
"x" = "This is the exposure",
"y" = "Here's the outcome",
"m" = "Here is where they collide"
)) |>
ggplot(aes_dag()) +
geom_dag_edges() +
geom_dag_point() +
geom_dag_text() +
geom_dag_label_repel(
aes(label = label, fill = label),
col = "white",
show.legend = FALSE
) +
theme_dag()
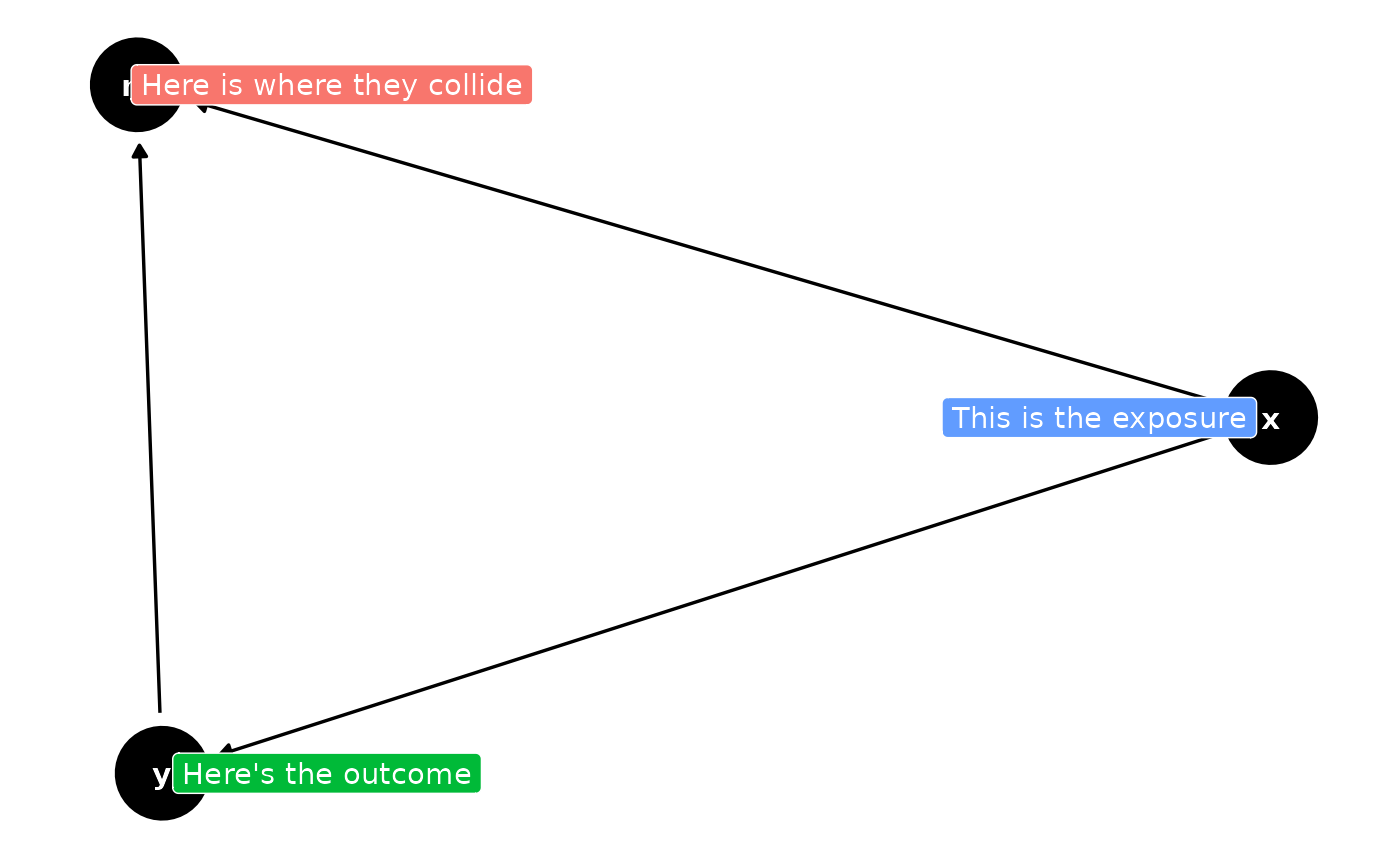
g |>
tidy_dagitty() |>
dag_label(labels = c(
"x" = "This is the exposure",
"y" = "Here's the outcome",
"m" = "Here is where they collide"
)) |>
ggplot(aes_dag()) +
geom_dag_edges() +
geom_dag_point() +
geom_dag_text() +
geom_dag_label_repel(
aes(label = label, fill = label),
col = "white",
show.legend = FALSE
) +
theme_dag()
 # Use directional repulsion
g |>
tidy_dagitty() |>
ggplot(aes_dag()) +
geom_dag_edges() +
geom_dag_point() +
geom_dag_text_repel(
aes(label = name),
direction = "y",
seed = 1234
) +
theme_dag()
# Use directional repulsion
g |>
tidy_dagitty() |>
ggplot(aes_dag()) +
geom_dag_edges() +
geom_dag_point() +
geom_dag_text_repel(
aes(label = name),
direction = "y",
seed = 1234
) +
theme_dag()
 # Customize segment appearance
g |>
tidy_dagitty() |>
ggplot(aes_dag()) +
geom_dag_edges() +
geom_dag_point() +
geom_dag_text_repel(
aes(label = name),
segment.linetype = 2,
segment.alpha = 0.5,
segment.curvature = -0.3
) +
theme_dag()
# Customize segment appearance
g |>
tidy_dagitty() |>
ggplot(aes_dag()) +
geom_dag_edges() +
geom_dag_point() +
geom_dag_text_repel(
aes(label = name),
segment.linetype = 2,
segment.alpha = 0.5,
segment.curvature = -0.3
) +
theme_dag()