geom_dag() is a helper function that adds common DAG layers to a ggplot.
The purpose of geom_dag() is to simplify making custom DAGs. Most custom
DAGs need the same basic layers, and so this function greatly reduces typing.
It is not a true geom in that it adds many types of geoms to the plot (by
default, edges, nodes, and text). While the underlying layers, all available
in ggdag, are true geoms, we usually need a consistent set of layers to make
a DAG. geom_dag() provides this. Because geom_dag() is not a true geom,
you'll find that it is awkward for sophisticated customization. When you hit
that point, you should use the underlying geoms directly.
Usage
geom_dag(
  data = NULL,
  size = 1,
  edge_type = c("link_arc", "link", "arc", "diagonal"),
  edge_engine = ggdag_option("edge_engine", "ggraph"),
  node_size = ggdag_option("node_size", 16),
  text_size = ggdag_option("text_size", 3.88),
  label_size = ggdag_option("label_size", text_size),
  text_col = ggdag_option("text_col", "white"),
  label_col = ggdag_option("label_col", "black"),
  edge_width = ggdag_option("edge_width", 0.6),
  edge_cap = ggdag_option("edge_cap", 8),
  arrow_length = ggdag_option("arrow_length", 5),
  use_edges = ggdag_option("use_edges", TRUE),
  use_nodes = ggdag_option("use_nodes", TRUE),
  use_stylized = ggdag_option("use_stylized", FALSE),
  use_text = ggdag_option("use_text", TRUE),
  use_labels = ggdag_option("use_labels", FALSE),
  label_geom = ggdag_option("label_geom", geom_dag_label_repel),
  n_edge_points = NULL,
  n_node_points = NULL,
  unified_legend = TRUE,
  key_glyph = NULL,
  label = NULL,
  text = NULL,
  node = deprecated(),
  stylized = deprecated()
)
Arguments
- data
The data to be displayed in this layer. There are three options:
If
NULL, the default, the data is inherited from the plot data as specified in the call toggplot().A
data.frame, or other object, will override the plot data. All objects will be fortified to produce a data frame. Seefortify()for which variables will be created.A
functionwill be called with a single argument, the plot data. The return value must be adata.frame, and will be used as the layer data. Afunctioncan be created from aformula(e.g.~ head(.x, 10)).- size
A numeric value scaling the size of all elements in the DAG. This allows you to change the scale of the DAG without changing the proportions.
- edge_type
The type of edge, one of "link_arc", "link", "arc", "diagonal".
- edge_engine
The engine used to draw edges. Either
"ggraph"(default) or"ggarrow". When"ggarrow", edges are drawn using ggarrow geoms, which support additional customization via thearrow_head,arrow_fins,arrow_mid, andcurvatureglobal options (seeggdag_options_set()).- node_size
The size of the nodes.
- text_size
The size of the text.
- label_size
The size of the labels.
- text_col
The color of the text.
- label_col
The color of the labels.
- edge_width
The width of the edges.
- edge_cap
The size of edge caps (the distance between the arrowheads and the node borders).
- arrow_length
The length of arrows on edges.
- use_edges
A logical value. Include a
geom_dag_edges*()function? IfTRUE, which is determined byedge_type.- use_nodes
A logical value. Include
geom_dag_point()?- use_stylized
A logical value. Include
geom_dag_node()?- use_text
A logical value. Include
geom_dag_text()?- use_labels
A logical value. Include a label geom? The specific geom used is controlled by
label_geom.- label_geom
A geom function to use for drawing labels when
use_labels = TRUE. Default isgeom_dag_label_repel. Other options includegeom_dag_label,geom_dag_text_repel,geom_dag_label_repel2, andgeom_dag_text_repel2.- n_edge_points
Number of invisible points to interpolate along each edge for label repulsion. Passed to repel label geoms. Defaults to
NULL(usesStatNodesRepeldefault of 50). Set to 0 to disable.- n_node_points
Number of invisible skeleton points to place around each node's perimeter for label repulsion. Passed to repel label geoms. Defaults to
NULL(usesStatNodesRepeldefault of 12). Set to 0 to disable.- unified_legend
A logical value. When
TRUEand bothuse_edgesanduse_nodesareTRUE, creates a unified legend entry showing both nodes and edges in a single key, and hides the separate edge legend. This creates cleaner, more compact legends. Default isTRUE.- key_glyph
A function to use for drawing the legend key glyph for nodes. If
NULL(the default), the glyph is chosen automatically based on theunified_legendsetting. When provided, this overrides the automatic selection. Common options includedraw_key_dag_point,draw_key_dag_combined, anddraw_key_dag_collider.- label
The bare name of a column to use for labels. If
use_labels = TRUE, the default is to uselabel.- text
The bare name of a column to use for
geom_dag_text(). Ifuse_text = TRUE, the default is to usename.- node
Deprecated.
- stylized
Deprecated.
Examples
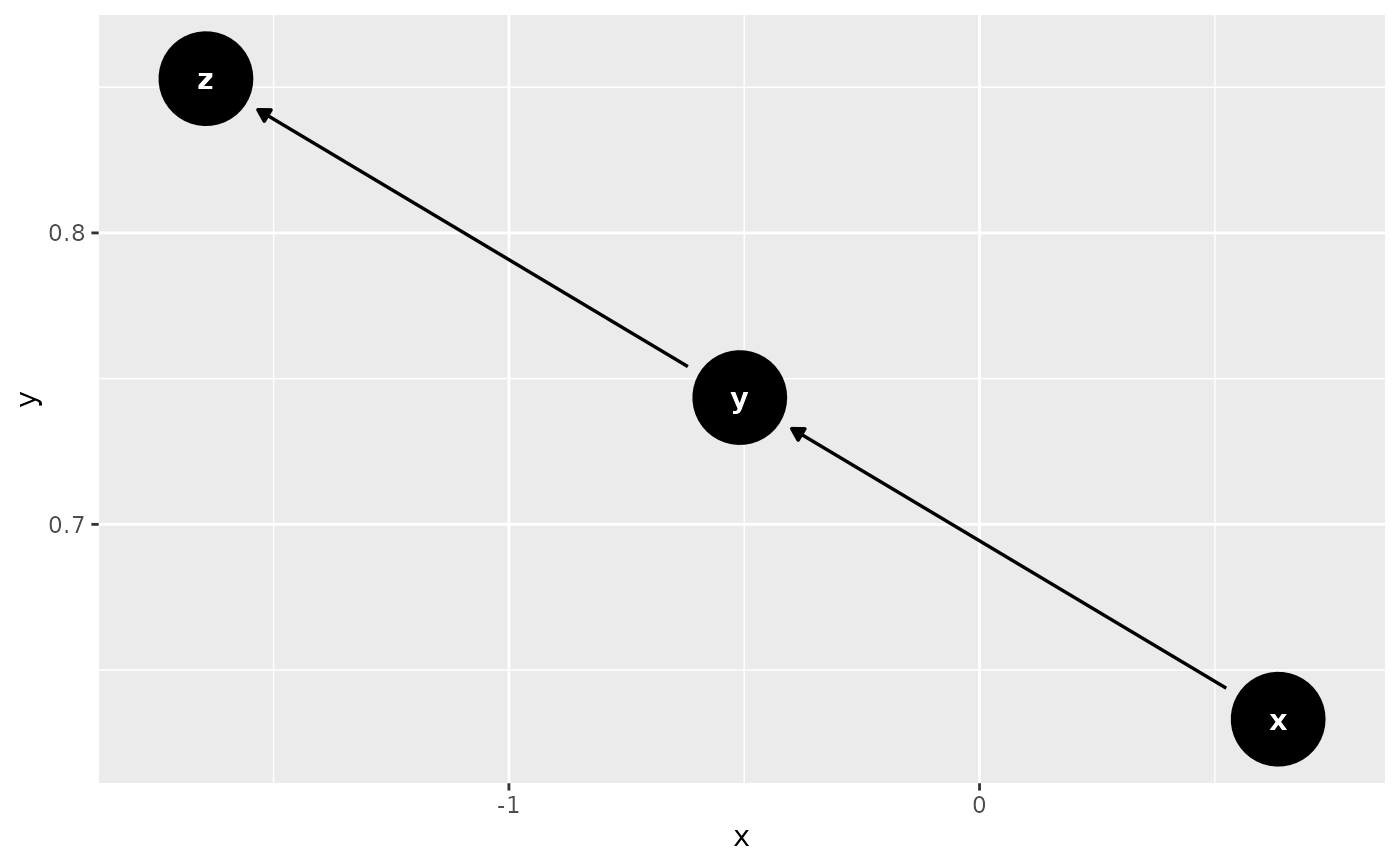
# Basic usage with ggdag
library(ggplot2)
dag <- dagify(y ~ x, z ~ y)
ggplot(dag, aes_dag()) +
geom_dag()
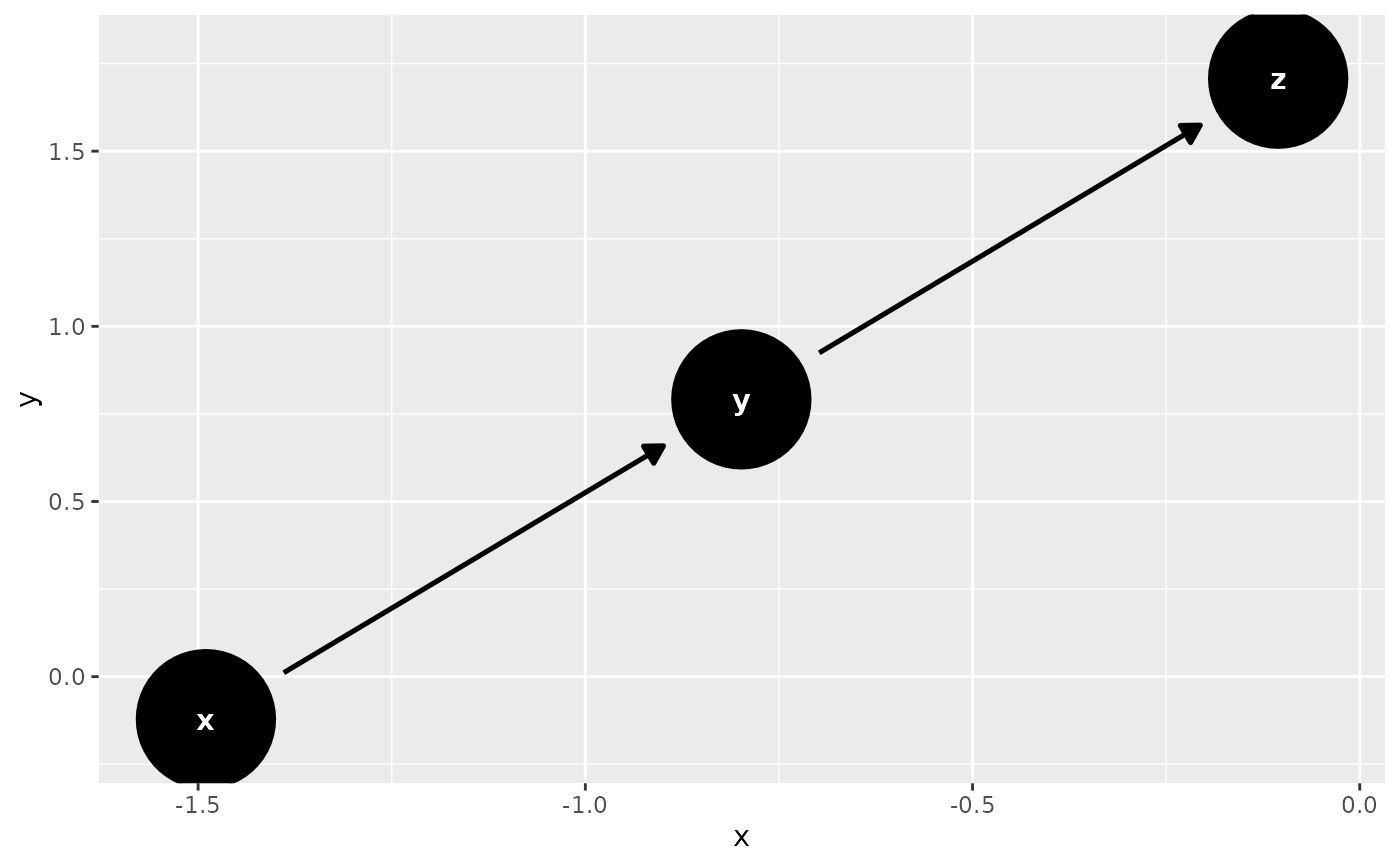
 ggplot(dag, aes_dag()) +
geom_dag(size = 1.5)
ggplot(dag, aes_dag()) +
geom_dag(size = 1.5)
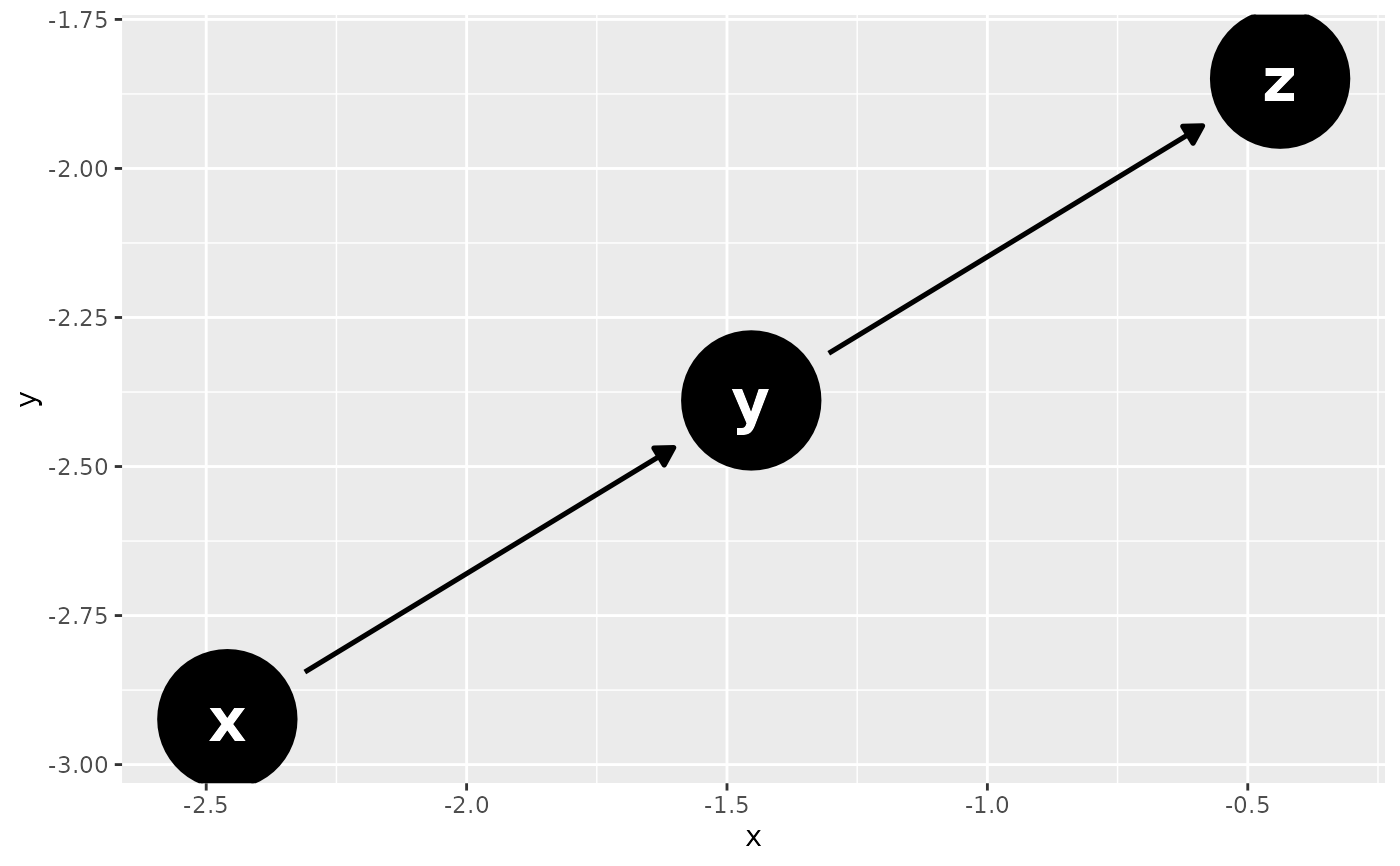
 ggplot(dag, aes_dag()) +
geom_dag(size = 1.5, text_size = 8)
ggplot(dag, aes_dag()) +
geom_dag(size = 1.5, text_size = 8)
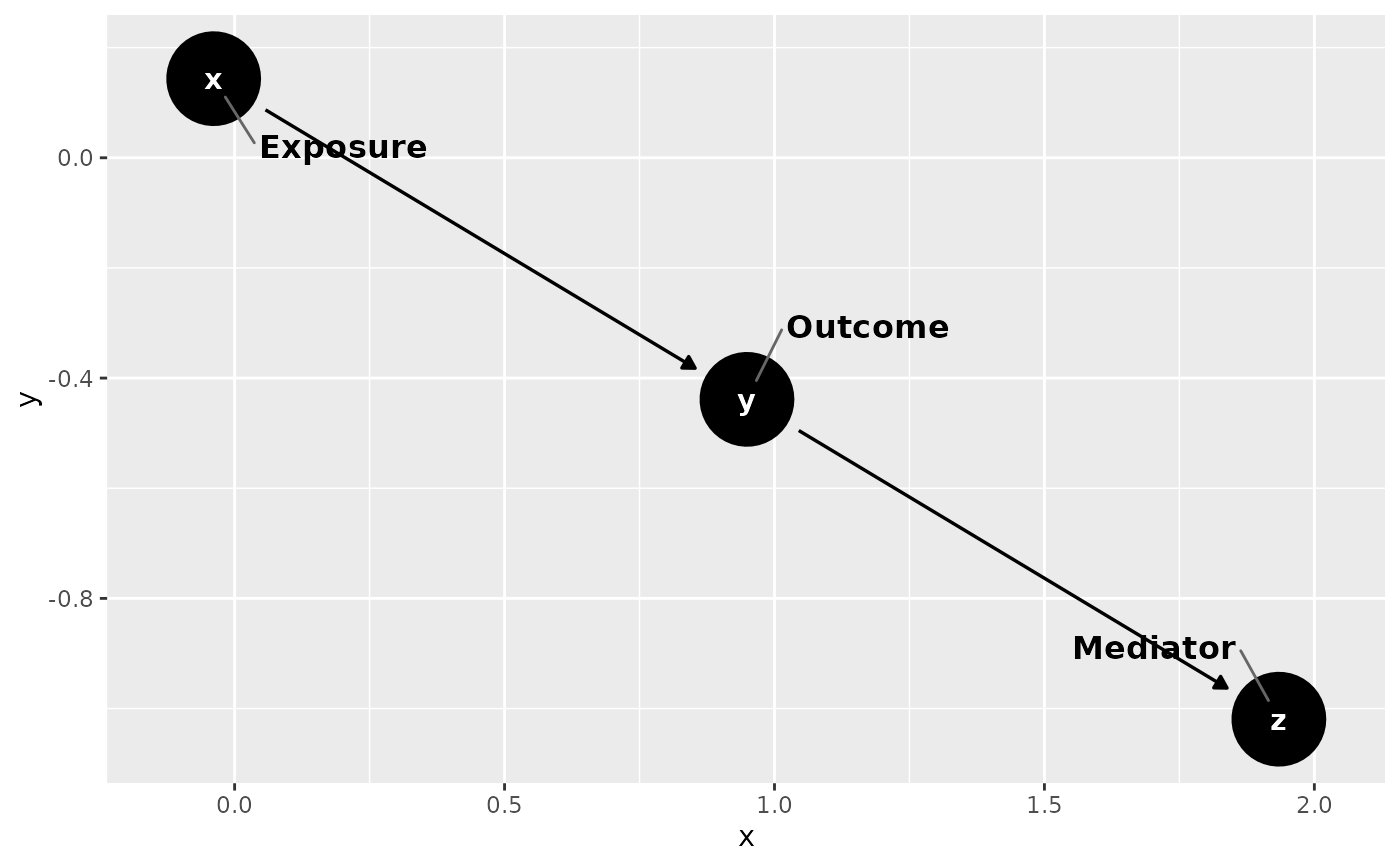
 # Using different label geoms
dag_labeled <- dagify(
y ~ x,
z ~ y,
labels = c(x = "Exposure", y = "Outcome", z = "Mediator")
)
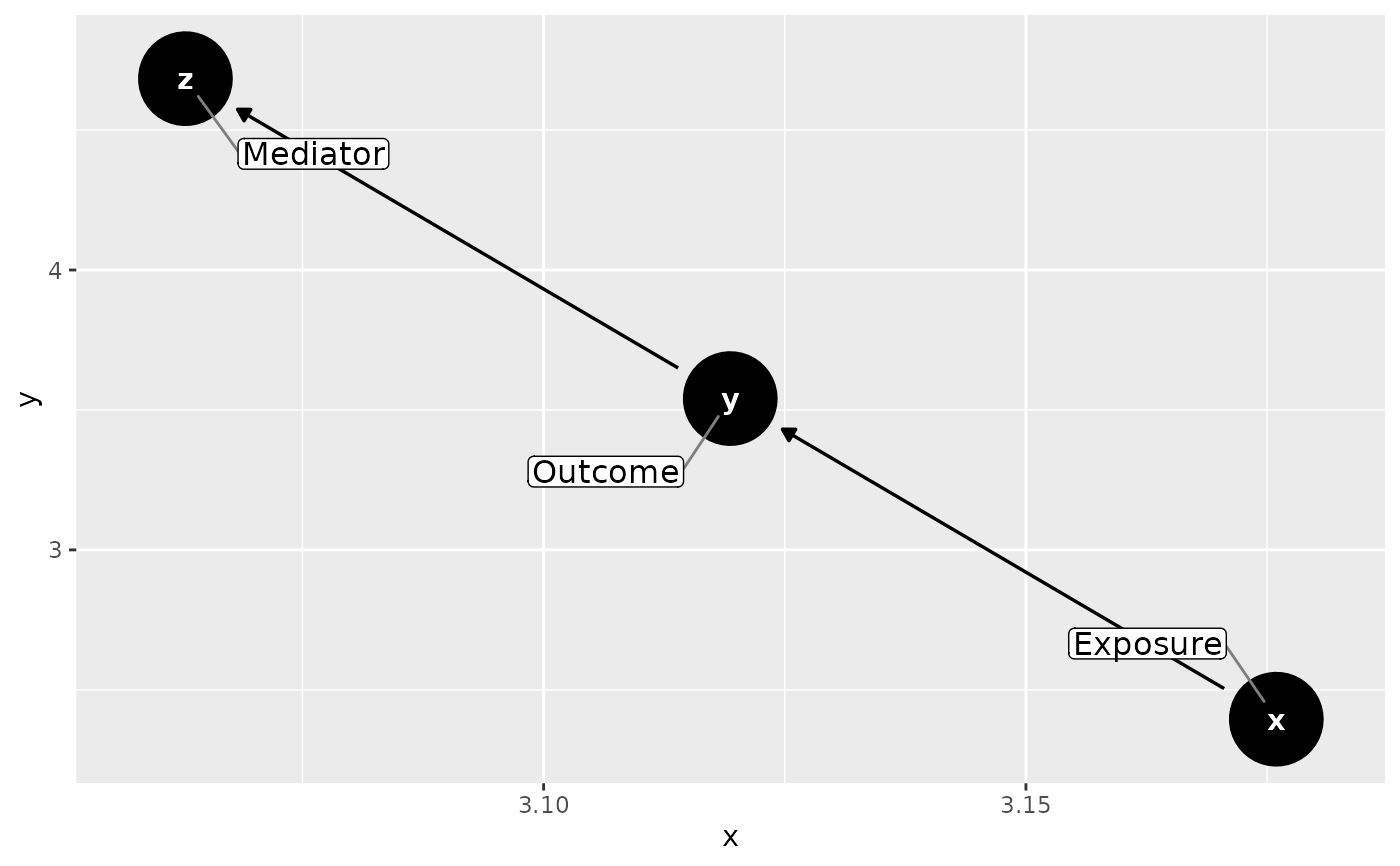
# Default: repelling labels
ggplot(dag_labeled, aes_dag()) +
geom_dag(use_labels = TRUE)
# Using different label geoms
dag_labeled <- dagify(
y ~ x,
z ~ y,
labels = c(x = "Exposure", y = "Outcome", z = "Mediator")
)
# Default: repelling labels
ggplot(dag_labeled, aes_dag()) +
geom_dag(use_labels = TRUE)
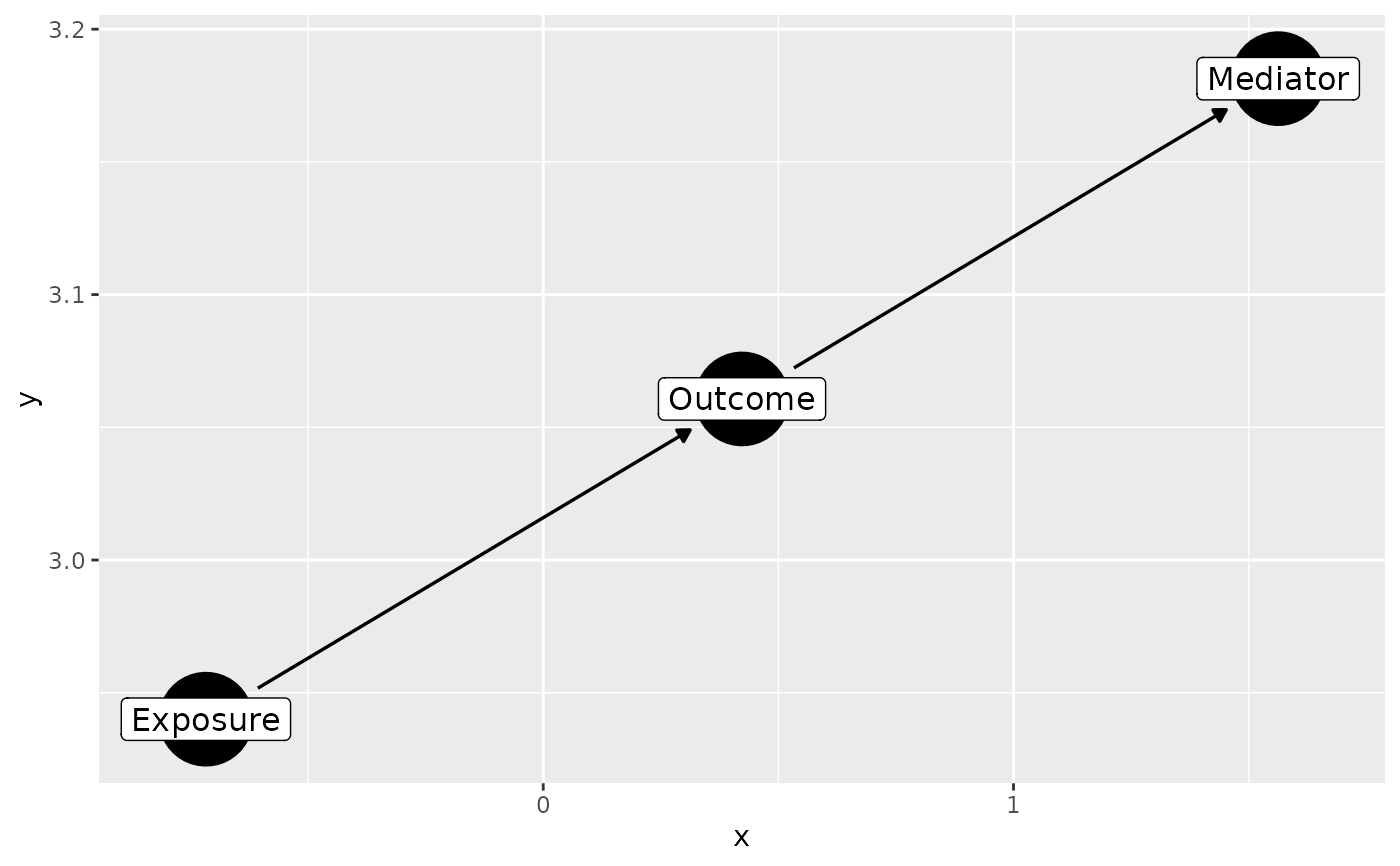
 # Static labels
ggplot(dag_labeled, aes_dag()) +
geom_dag(use_labels = TRUE, label_geom = geom_dag_label)
# Static labels
ggplot(dag_labeled, aes_dag()) +
geom_dag(use_labels = TRUE, label_geom = geom_dag_label)
 # Repelling text instead of labels
ggplot(dag_labeled, aes_dag()) +
geom_dag(use_labels = TRUE, label_geom = geom_dag_text_repel)
# Repelling text instead of labels
ggplot(dag_labeled, aes_dag()) +
geom_dag(use_labels = TRUE, label_geom = geom_dag_text_repel)