Adjust for variables and activate any biasing paths that result
Source:R/adjustment_sets.R
control_for.RdAdjust for variables and activate any biasing paths that result
Usage
control_for(.tdy_dag, var, as_factor = TRUE, activate_colliders = TRUE, ...)

adjust_for(.tdy_dag, var, as_factor = TRUE, activate_colliders = TRUE, ...)

ggdag_adjust(
  .tdy_dag,
  var = NULL,
  ...,
  size = 1,
  edge_type = c("link_arc", "link", "arc", "diagonal"),
  node_size = ggdag_option("node_size", 16),
  text_size = ggdag_option("text_size", 3.88),
  label_size = ggdag_option("label_size", text_size),
  text_col = ggdag_option("text_col", "white"),
  label_col = ggdag_option("label_col", "black"),
  edge_width = ggdag_option("edge_width", 0.6),
  edge_cap = ggdag_option_proportional("edge_cap", 8, 10),
  arrow_length = ggdag_option("arrow_length", 5),
  use_edges = ggdag_option("use_edges", TRUE),
  use_nodes = ggdag_option("use_nodes", TRUE),
  use_stylized = ggdag_option("use_stylized", FALSE),
  use_text = ggdag_option("use_text", TRUE),
  use_labels = ggdag_option("use_labels", FALSE),
  label_geom = ggdag_option("label_geom", geom_dag_label_repel),
  key_glyph = draw_key_dag_point,
  text = NULL,
  label = NULL,
  node = deprecated(),
  stylized = deprecated(),
  collider_lines = TRUE
)
Arguments
- .tdy_dag
A
tidy_dagittyordagittyobject- var
a character vector, the variable(s) to adjust for.
- as_factor
Logical. Should the column be a factor?
- activate_colliders
logical. Include colliders activated by adjustment?
- ...
additional arguments passed to
tidy_dagitty()- size
A numeric value scaling the size of all elements in the DAG. This allows you to change the scale of the DAG without changing the proportions.
- edge_type
The type of edge, one of "link_arc", "link", "arc", "diagonal".
- node_size
The size of the nodes.
- text_size
The size of the text.
- label_size
The size of the labels.
- text_col
The color of the text.
- label_col
The color of the labels.
- edge_width
The width of the edges.
- edge_cap
The size of edge caps (the distance between the arrowheads and the node borders).
- arrow_length
The length of arrows on edges.
- use_edges
A logical value. Include a
geom_dag_edges*()function? IfTRUE, which is determined byedge_type.- use_nodes
A logical value. Include
geom_dag_point()?- use_stylized
A logical value. Include
geom_dag_node()?- use_text
A logical value. Include
geom_dag_text()?- use_labels
A logical value. Include a label geom? The specific geom used is controlled by
label_geom.- label_geom
A geom function to use for drawing labels when
use_labels = TRUE. Default isgeom_dag_label_repel. Other options includegeom_dag_label,geom_dag_text_repel,geom_dag_label_repel2, andgeom_dag_text_repel2.- key_glyph
A function to use for drawing the legend key glyph for nodes. If
NULL(the default), the glyph is chosen automatically based on theunified_legendsetting. When provided, this overrides the automatic selection. Common options includedraw_key_dag_point,draw_key_dag_combined, anddraw_key_dag_collider.- text
The bare name of a column to use for
geom_dag_text(). Ifuse_text = TRUE, the default is to usename.- label
The bare name of a column to use for labels. If
use_labels = TRUE, the default is to uselabel.- node
Deprecated.
- stylized
Deprecated.
- collider_lines
logical. Should the plot show paths activated by adjusting for a collider?
Value
a tidy_dagitty with a adjusted column for adjusted
variables, as well as any biasing paths that arise, or a ggplot
Examples
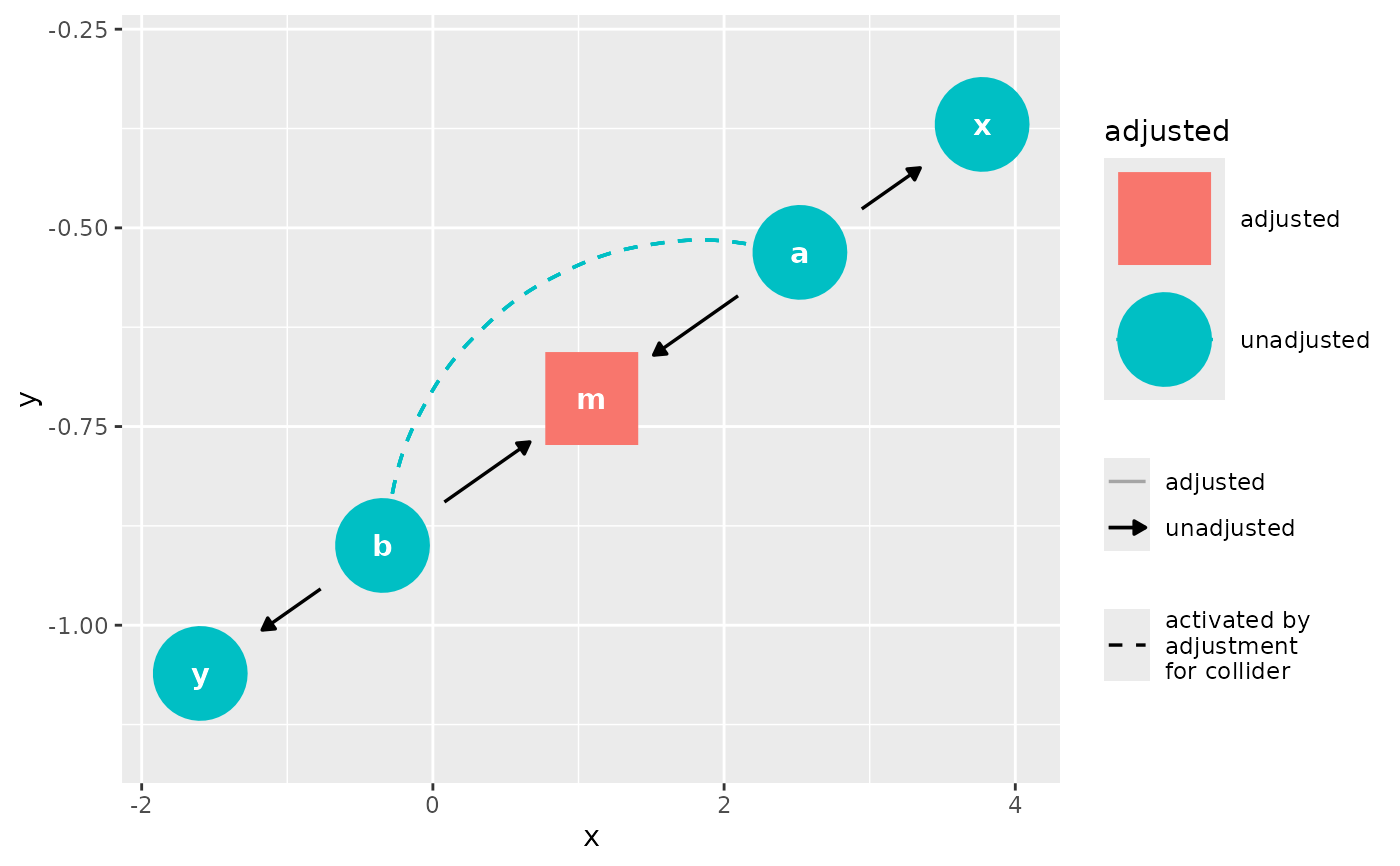
dag <- dagify(m ~ a + b, x ~ a, y ~ b)

control_for(dag, var = "m")
#> # DAG:
#> # A `dagitty` DAG with: 5 nodes and 4 edges
#> # Paths opened by conditioning on a collider: a <-> b, a <-> b, a <-> b, a <-> b
#> #
#> # Data:
#> # A tibble: 11 × 9
#>    name         x         y direction to        xend      yend collider_line
#>    <chr>    <dbl>     <dbl> <fct>     <chr>    <dbl>     <dbl> <lgl>
#>  1 a      1.44    -2.95e-10 ->        m     -0.00334 -6.27e-10 FALSE
#>  2 a      1.44    -2.95e-10 ->        x      2.71     4.78e-10 FALSE
#>  3 b     -1.45     3.25e-12 ->        m     -0.00334 -6.27e-10 FALSE
#>  4 b     -1.45     3.25e-12 ->        y     -2.70     4.41e-10 FALSE
#>  5 m     -0.00334 -6.27e-10 NA        NA    NA       NA        FALSE
#>  6 x      2.71     4.78e-10 NA        NA    NA       NA        FALSE
#>  7 y     -2.70     4.41e-10 NA        NA    NA       NA        FALSE
#>  8 a      1.44    -2.95e-10 <->       b     -1.45     3.25e-12 TRUE
#>  9 a      1.44    -2.95e-10 <->       b     -1.45     3.25e-12 TRUE
#> 10 a      1.44    -2.95e-10 <->       b     -1.45     3.25e-12 TRUE
#> 11 a      1.44    -2.95e-10 <->       b     -1.45     3.25e-12 TRUE
#> # ℹ 1 more variable: adjusted <fct>
#> #
#> # ℹ Use `pull_dag() (`?pull_dag`)` to retrieve the DAG object and `pull_dag_data() (`?pull_dag_data`)` for the data frame
ggdag_adjust(dag, var = "m")