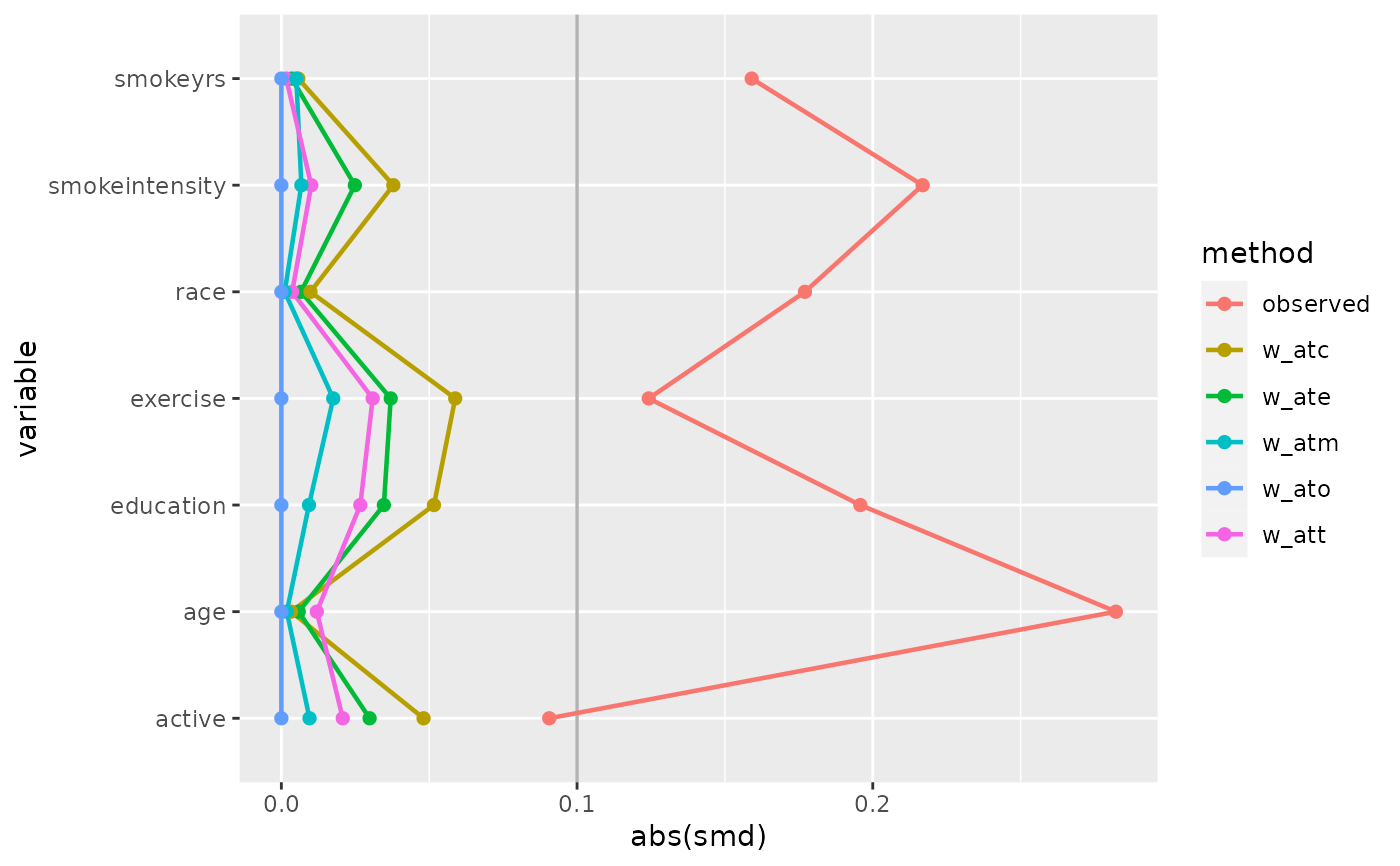
geom_love() and love_plot() are helper functions to create Love plots in
ggplot2. Love plots are a diagnostic approach to assessing balance before and
after weighting. Many researchers use 0.1 on the absolute SMD scale to
evaluate if a variable is well-balanced between groups, although this is just
a rule of thumb. geom_love() is a simple wrapper around
ggplot2::geom_point(), ggplot2::geom_line(), and
ggplot2::geom_vline(). It also adds default aesthetics via
ggplot2::aes(). love_plot() is a quick plotting function that further
wraps geom_love(). For more complex Love plots, we recommend using ggplot2
directly.
geom_love(
  data = NULL,
  linewidth = 0.8,
  line_size = NULL,
  point_size = 1.85,
  vline_xintercept = 0.1,
  vline_color = "grey70",
  vlinewidth = 0.6,
  vline_size = NULL
)

love_plot(
  .df,
  linewidth = 0.8,
  line_size = NULL,
  point_size = 1.85,
  vline_xintercept = 0.1,
  vline_color = "grey70",
  vlinewidth = 0.6,
  vline_size = NULL
)
Arguments
- data
The data to be displayed in this layer. There are three options:
If
NULL, the default, the data is inherited from the plot data as specified in the call toggplot().A
data.frame, or other object, will override the plot data. All objects will be fortified to produce a data frame. Seefortify()for which variables will be created.A
functionwill be called with a single argument, the plot data. The return value must be adata.frame, and will be used as the layer data. Afunctioncan be created from aformula(e.g.~ head(.x, 10)).- linewidth
The line size, passed to
ggplot2::geom_line().- line_size
Deprecated. Please use
linewidth.- point_size
The point size, passed to
ggplot2::geom_point().- vline_xintercept
The X intercept, passed to
ggplot2::geom_vline().- vline_color
The vertical line color, passed to
ggplot2::geom_vline().- vlinewidth
The vertical line size, passed to
ggplot2::geom_vline().- vline_size
Deprecated. Please use
vlinewidth.- .df
a data frame produced by
tidy_smd()
Value
a list of geoms or a ggplot